GitSwarm-EE 2017.1-1 Documentation
Health Check
Introduced in GitSwarm 2016.2.
GitSwarm provides a health check endpoint for uptime monitoring on the health_check web endpoint. The health check reports on the overall system status based on the status of the database connection, the state of the database migrations, and the ability to write and access the cache. This endpoint can be provided to uptime monitoring services like Pingdom, Nagios, and NewRelic.
Access Token
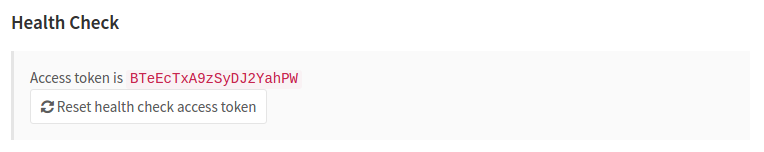
An access token needs to be provided while accessing the health check endpoint. The current accepted token can be found on the admin/health_check page of your GitSwarm instance.
The access token can be passed as a URL parameter:
https://gitswarm.example.com/health_check.json?token=ACCESS_TOKENor as an HTTP header:
curl --header "TOKEN: ACCESS_TOKEN" https://gitswarm.example.com/health_check.jsonUsing the Endpoint
Once you have the access token, health information can be retrieved as plain text, JSON, or XML using the health_check endpoint:
https://gitswarm.example.com/health_check?token=ACCESS_TOKENhttps://gitswarm.example.com/health_check.json?token=ACCESS_TOKENhttps://gitswarm.example.com/health_check.xml?token=ACCESS_TOKEN
You can also ask for the status of specific services:
https://gitswarm.example.com/health_check/cache.json?token=ACCESS_TOKENhttps://gitswarm.example.com/health_check/database.json?token=ACCESS_TOKENhttps://gitswarm.example.com/health_check/migrations.json?token=ACCESS_TOKEN
For example, the JSON output of the following health check:
curl --header "TOKEN: ACCESS_TOKEN" https://gitswarm.example.com/health_check.jsonwould be like:
{"healthy":true,"message":"success"}Status
On failure, the endpoint will return a 500 HTTP status code. On success, the endpoint will return a valid successful HTTP status code, and a success message. Ideally your uptime monitoring should look for the success message.